There have been doomsday predictions evoking the end of web analytics when GDPR was set in place. Months of uncertainty followed until the European Court of Justice confirmed a first instance decision from Germany. So called “Planet49-judgement” made clear: Consent is needed for any not strictly necessary cookie! What many local data protection authorities demanded for months, now had become a “set in stone” requirement for GDPR compliance.
Our team followed the situation carefully even way before and was not hit by the judgement out of the blue. But to be honest, no one was happy about the new certainty! We were aware of first very trivial tests forecasting Opt-in rates of approx. 30%, which would have meant a massive setback in all our ambitions to continue building a smart web analytics landscape for our most-relevant customer facing platforms! Not less important the fact of fines up to 4% of global revenue for GDPR violations!
So we set ourselves two primary goals:
- be GDPR compliant ASAP!
- lose as few trackable users as possible!
Effectively it took us three months until we achieved these goals. With an overall Opt-in rate of 70% we can tell to have done something right. Here is how we did:
We are analysts! We love to test and – even more – we love to tell!
Even if an analyst is clueless what to do, there is always one idea left: “Let´s do an A/B test!” – and so we did! Placements, colors, wording, animations, icons – a whole lot of stuff to take into consideration when starting from the scratch. After just one short brainstorming our flipchart was filled with 144 experiences and test concepts for the next 18 months – but would we have been able to fulfill Goal #1 then? For sure not!
We had to slice the elephant and to focus on two key aspects to create results in the quickest manner. The test design was reduced and concentrated to two phases:
- General Placement and interaction design
- Adapt learnings to GDPR compliance model
Test Phase 1: General Placement and interaction design
We had to gather statistical evidence whether users would respect a temperate approach by using non-disturbing banners at the pages bottom or are more likely to Opt-in on attention grabbing elements.
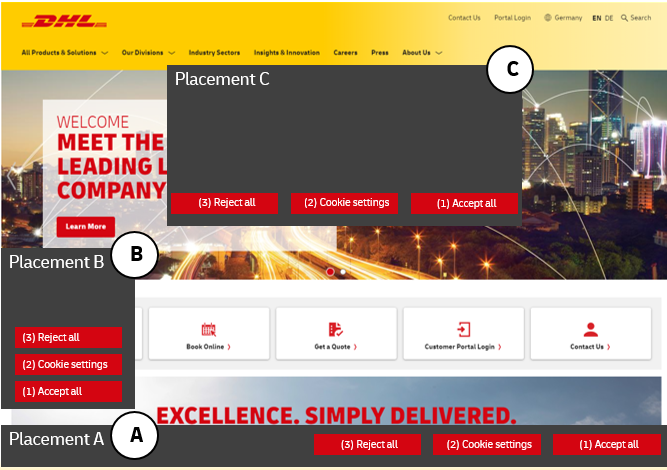
Placements and Interactions
Three different placements and button sets were tested
(= 9 Experiences)
Placements:
A) Bottom layer
B) Corner left
C) Overlay
Button sets:
1) Button: Accept all / Textlink: Cookie settings
2) Buttons: Accept all & Cookie settings
3) Buttons: Accept all & Cookie settings & Reject all
Results and interpretation:
Facts & Figures:
Experience C1 performed best with ~56% opt-in rate.

All experiences:
| # | Experience | % Opt-in Rate |
| A1 | Bottom Layer | 39,6 |
| A2 | Bottom Layer | 36,0 |
| A3 | Bottom Layer | 30,4 |
| B1 | Corner left | 35,1 |
| B2 | Corner left | 33,5 |
| B3 | Corner left | 28,7 |
| C1 | Centered overlay | 56,1 |
| C2 | Centered overlay | 52,6 |
| C3 | Centered overlay | 32,8 |
Interpretation:
We uderstood the wide range of Opt-in rates as: „The more annoying a banner, the better for us“. Data showed a clear indication that users are more likely to interact with banners that pop to their eyes (Placements C).
If users are able to consume contents while ignoring banners, the will do so at large numbers without giving consent (Placements A & B). If users are given the chance to reject all cookies, they will do so!
Decision:
Continue testing in Phase 2 with B and C placements only.
Test Phase 2: Adapt learnings to GDPR best practice model
Phase 1 results clearly showed that Placement A are not worth continue testing. In Phase 2 we wanted to find the best compromise of causing as few disturbance to users but collecting as many Opt-ins as possible. Still watching the development of legislation carefully it has become clear that each and every cookie category purpose has to be described in detail with a chance to Opt-in / Opt-out individually on first sight. Both we had to take into consideration when creating 4 experiences for Test Phase 2:
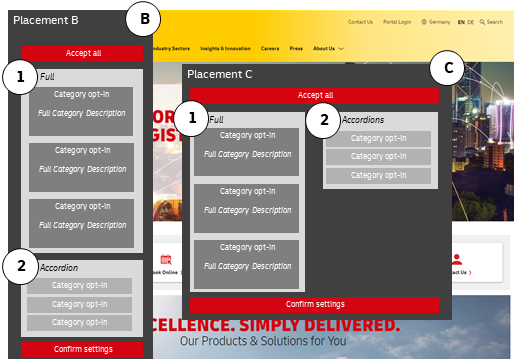
Placements and Interactions
Two different placements and category description detail layers are to be tested
(=4 Experiences)
Placements:
B) Panel left
C) Overlay
Button sets: 1) Full category descriptions
2) Category descriptions in accordions
Results and interpretation:
Facts & Figures:
Experience B1 performed best with ~70% opt-in rate.
All experiences:
| # | Experience | % Opt-in Rate |
| B1 | Panel left full detail description | 70 |
| B2 | Panel left accordion detail description | 64 |
| C1 | Centered overlay full detail description | 62 |
| C2 | Centered overlay accordion detail description | 55 |
Interpretation:
We assume most users are lazy readers. So if a text seems as formal as it can be and a module provides many category Opt-ins at the same time, users seem to build trust. They seem to be more open to continue/start their customer journey by clicking “Accept All cookies” than looking for alternative options.
Decision:
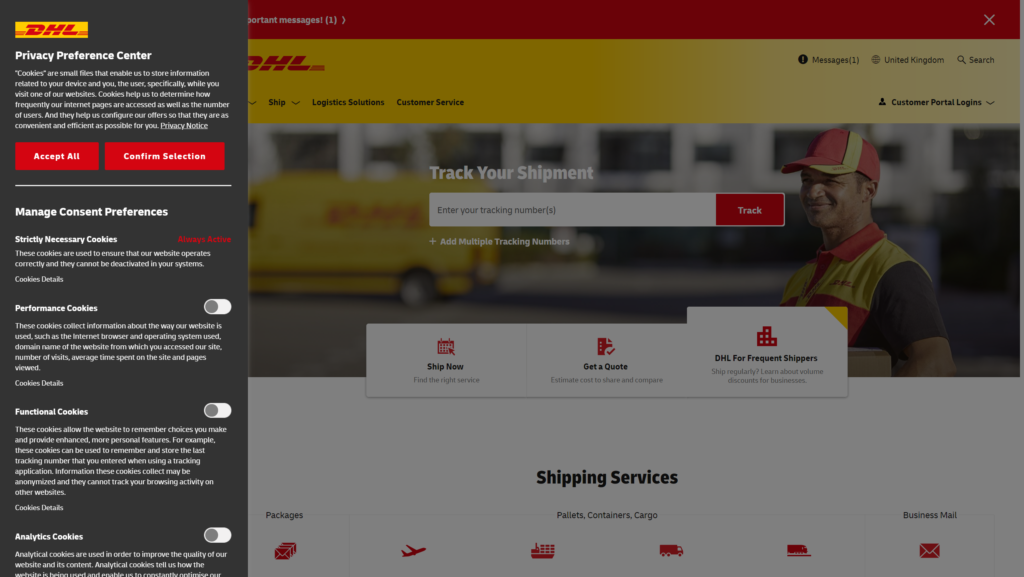
Rollout with new Cookie Consent module as successfully tested in EXP B1. Inform Stakeholders about a potential analytics data reduction by approx. 30%.
Conclusion: Take your time to test and engage
To be honest, one can easily imagine a whole lot of projects more fun than spending many weeks with compliance requirements. But always keep in mind that GDPR-compliance is the foundation for working with digital data and to gain your customers’ trust. The wide range of Opt-in rates – even if some experiences looked very similar – showed that is was worth every minute effort. Our new cookie consent module is live since May 2020 and it is confirming the projected rates of 70% almost every day since go live!
Sure, this is not a blueprint applicable for every website of the world. But for our users and their customers journeys this module works best.
Be aware that you cannot talk away GDPR requirements. Engage with your legal and/or data protection department, get them on your team and evolve solutions together instead of confronting each other – you are on the same boat!
Our journey isn’t over yet. We plan to test at least different copies in the next month, to build an even more trustful relationship with our users. And we learned that collecting data is not everything, respecting the user’s wish to be not tracked and focusing on qualitative insights instead of collecting more and more data, gains trust and also helps the business to grow.